Phase 1: Azure Custom Vision
Initial Detection Baseline
Established a baseline using Azure Custom Vision to rapidly prototype a model capable of localizing structural defects in MoS₂ lattices.
- ImageJ Integration: Converted manual labels into Azure-compatible coordinate formats.
- Training Split: Implemented an 80/20 train-test split for objective performance evaluation.
- Resource Management: Leveraged Azure cloud computing for efficient model iteration.
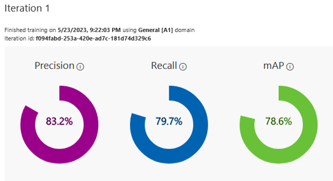 Figure 1: Iteration 1 performance metrics from Azure Custom Vision, showing Precision, Recall, and mAP.
Phase 2: Multiclass Labeling with Roboflow
Transition to YOLOv5 Architecture
To differentiate specific types of defects, we transitioned to YOLOv5 and used Roboflow for advanced multiclass annotation management.
- Defect Classification: Categorized defects into Broken Region, Vacancy, and Replacement.
- Dataset Management: Managed multiclass labels and exported them directly into YOLOv5 PyTorch formats (.txt and .yaml).
- Annotation Accuracy: Improved label consistency to better address the complexity of atomic-scale defect features.
# data.yaml Example
train: ../train/images
val: ../valid/images
nc: 3
names: ['Broken Region', 'Replacement', 'Vacancy']
Phase 3: Image Preprocessing
Enhancing Data Quality
Applied professional image filters to the raw microscopy data to improve detection of subtle features:
- Gaussian & Median Filters: Effectively reduced background noise and instrumentation artifacts.
- Contrast Optimization: Adjusted contrast (~8.71) to enhance the visibility of atomic vacancies.
- "Ice" Color Map: Provided the most distinct visual contrast for deep learning feature extraction.
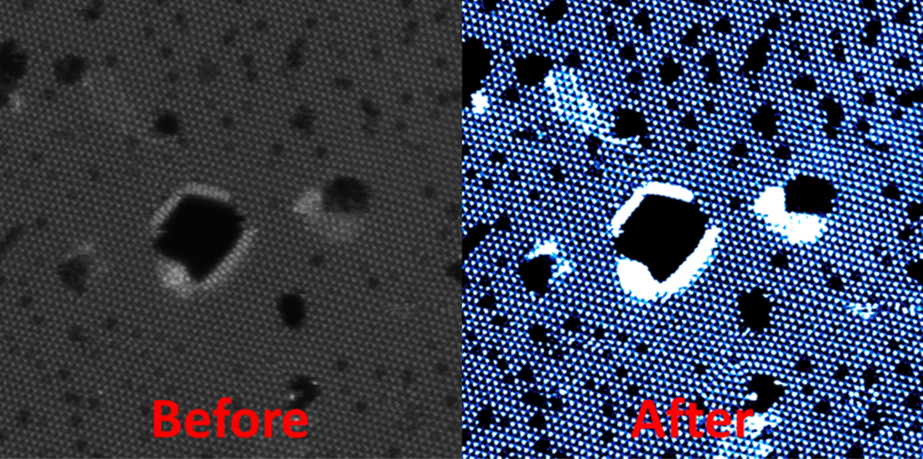 Figure 2: Comparison between raw microscopy data and preprocessed images for enhanced defect visibility.
Phase 4: Technical Verification
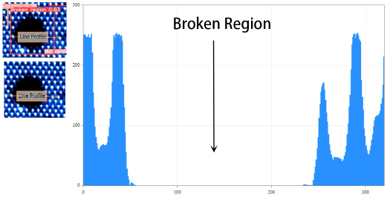 Figure 3: Intensity line profiles used to confirm model predictions against physical atomic data.
Cross-Referencing Model Predictions
Verified deep learning results using Intensity Line Profiles (Nion Swift) to ensure physical validity:
- Broken Regions: Confirmed by significant and total intensity drops in the profile peaks.
- Atomic Vacancies: Verified by periodic, specific intensity dips corresponding to Mo/S atomic positions.
- Scientific Robustness: Secondary physical verification ensured the model accurately captured the intended chemical features.
Model Generalizability
The final model was evaluated using MoS₂ images from peer-reviewed literature. It demonstrated a high ability to detect defects across unseen images from different sources, proving its value as a generalized tool for semiconductor and material science inspection.